1. Volumetric measurements
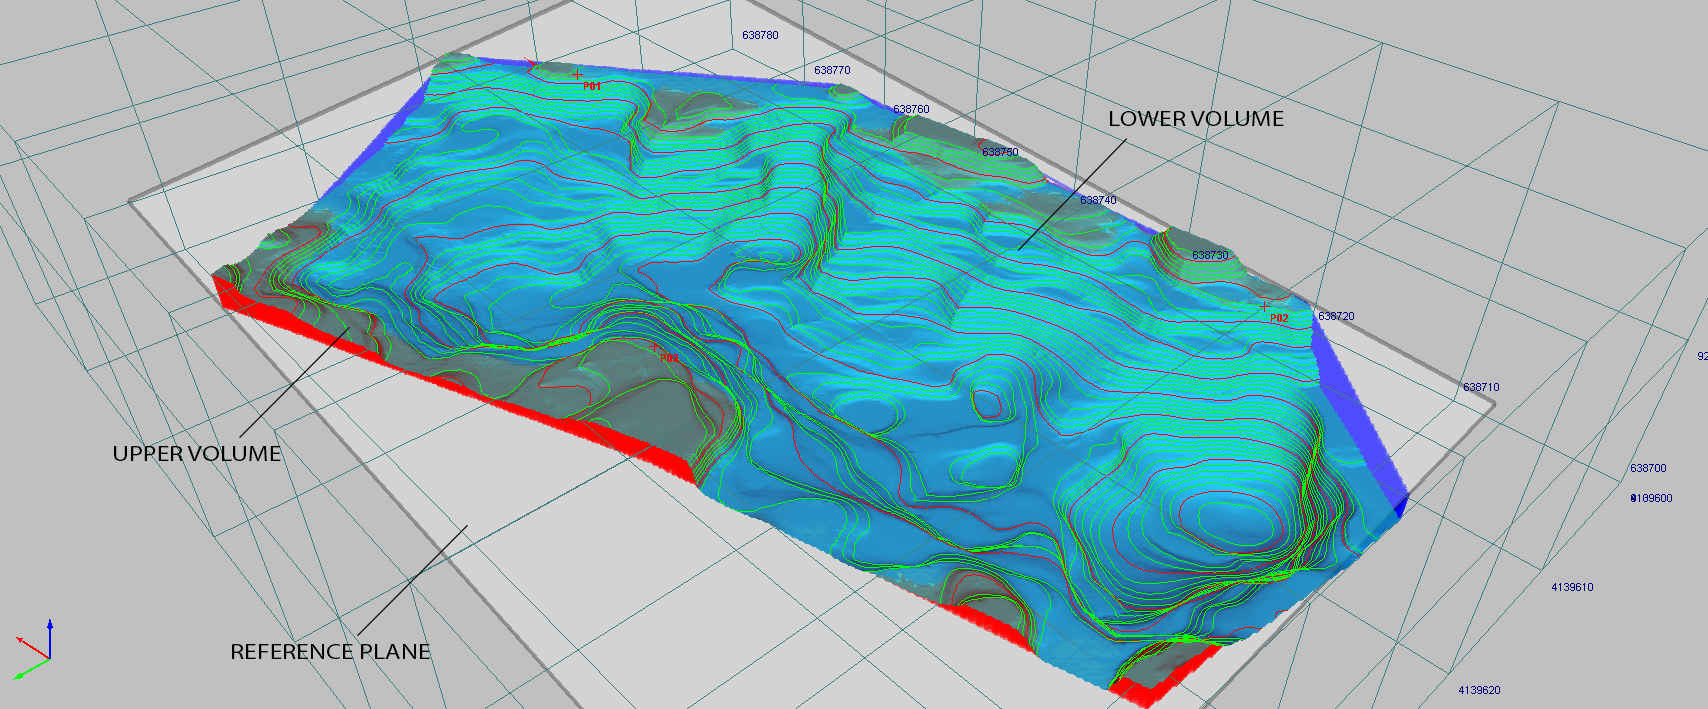
The two main methods chosen for metric documentation of the quarries were GPS and HDS (High Definition Surveying – 3D laser scanning). Findspots for small, discarded artefacts, as well as the location of the marble samples were captured by GPS receivers: standard navigation L1 GPS was used for tracking the current field-team location and movements and L1, L2 RTK for detailed registration of shapes and depth of discovered structures as well as coordinates of collected samples. The 48 channel L1, L2 receiver provided resolution measurements to the centimetre in DGPS mode. For all other surveying purposes, the UTM 35 N (EPSG 32635) coordinate system was employed. The volumetric measurements were carried out according to DTM tin surface extracted from laser scans and reference plane.
2. Analytical methods
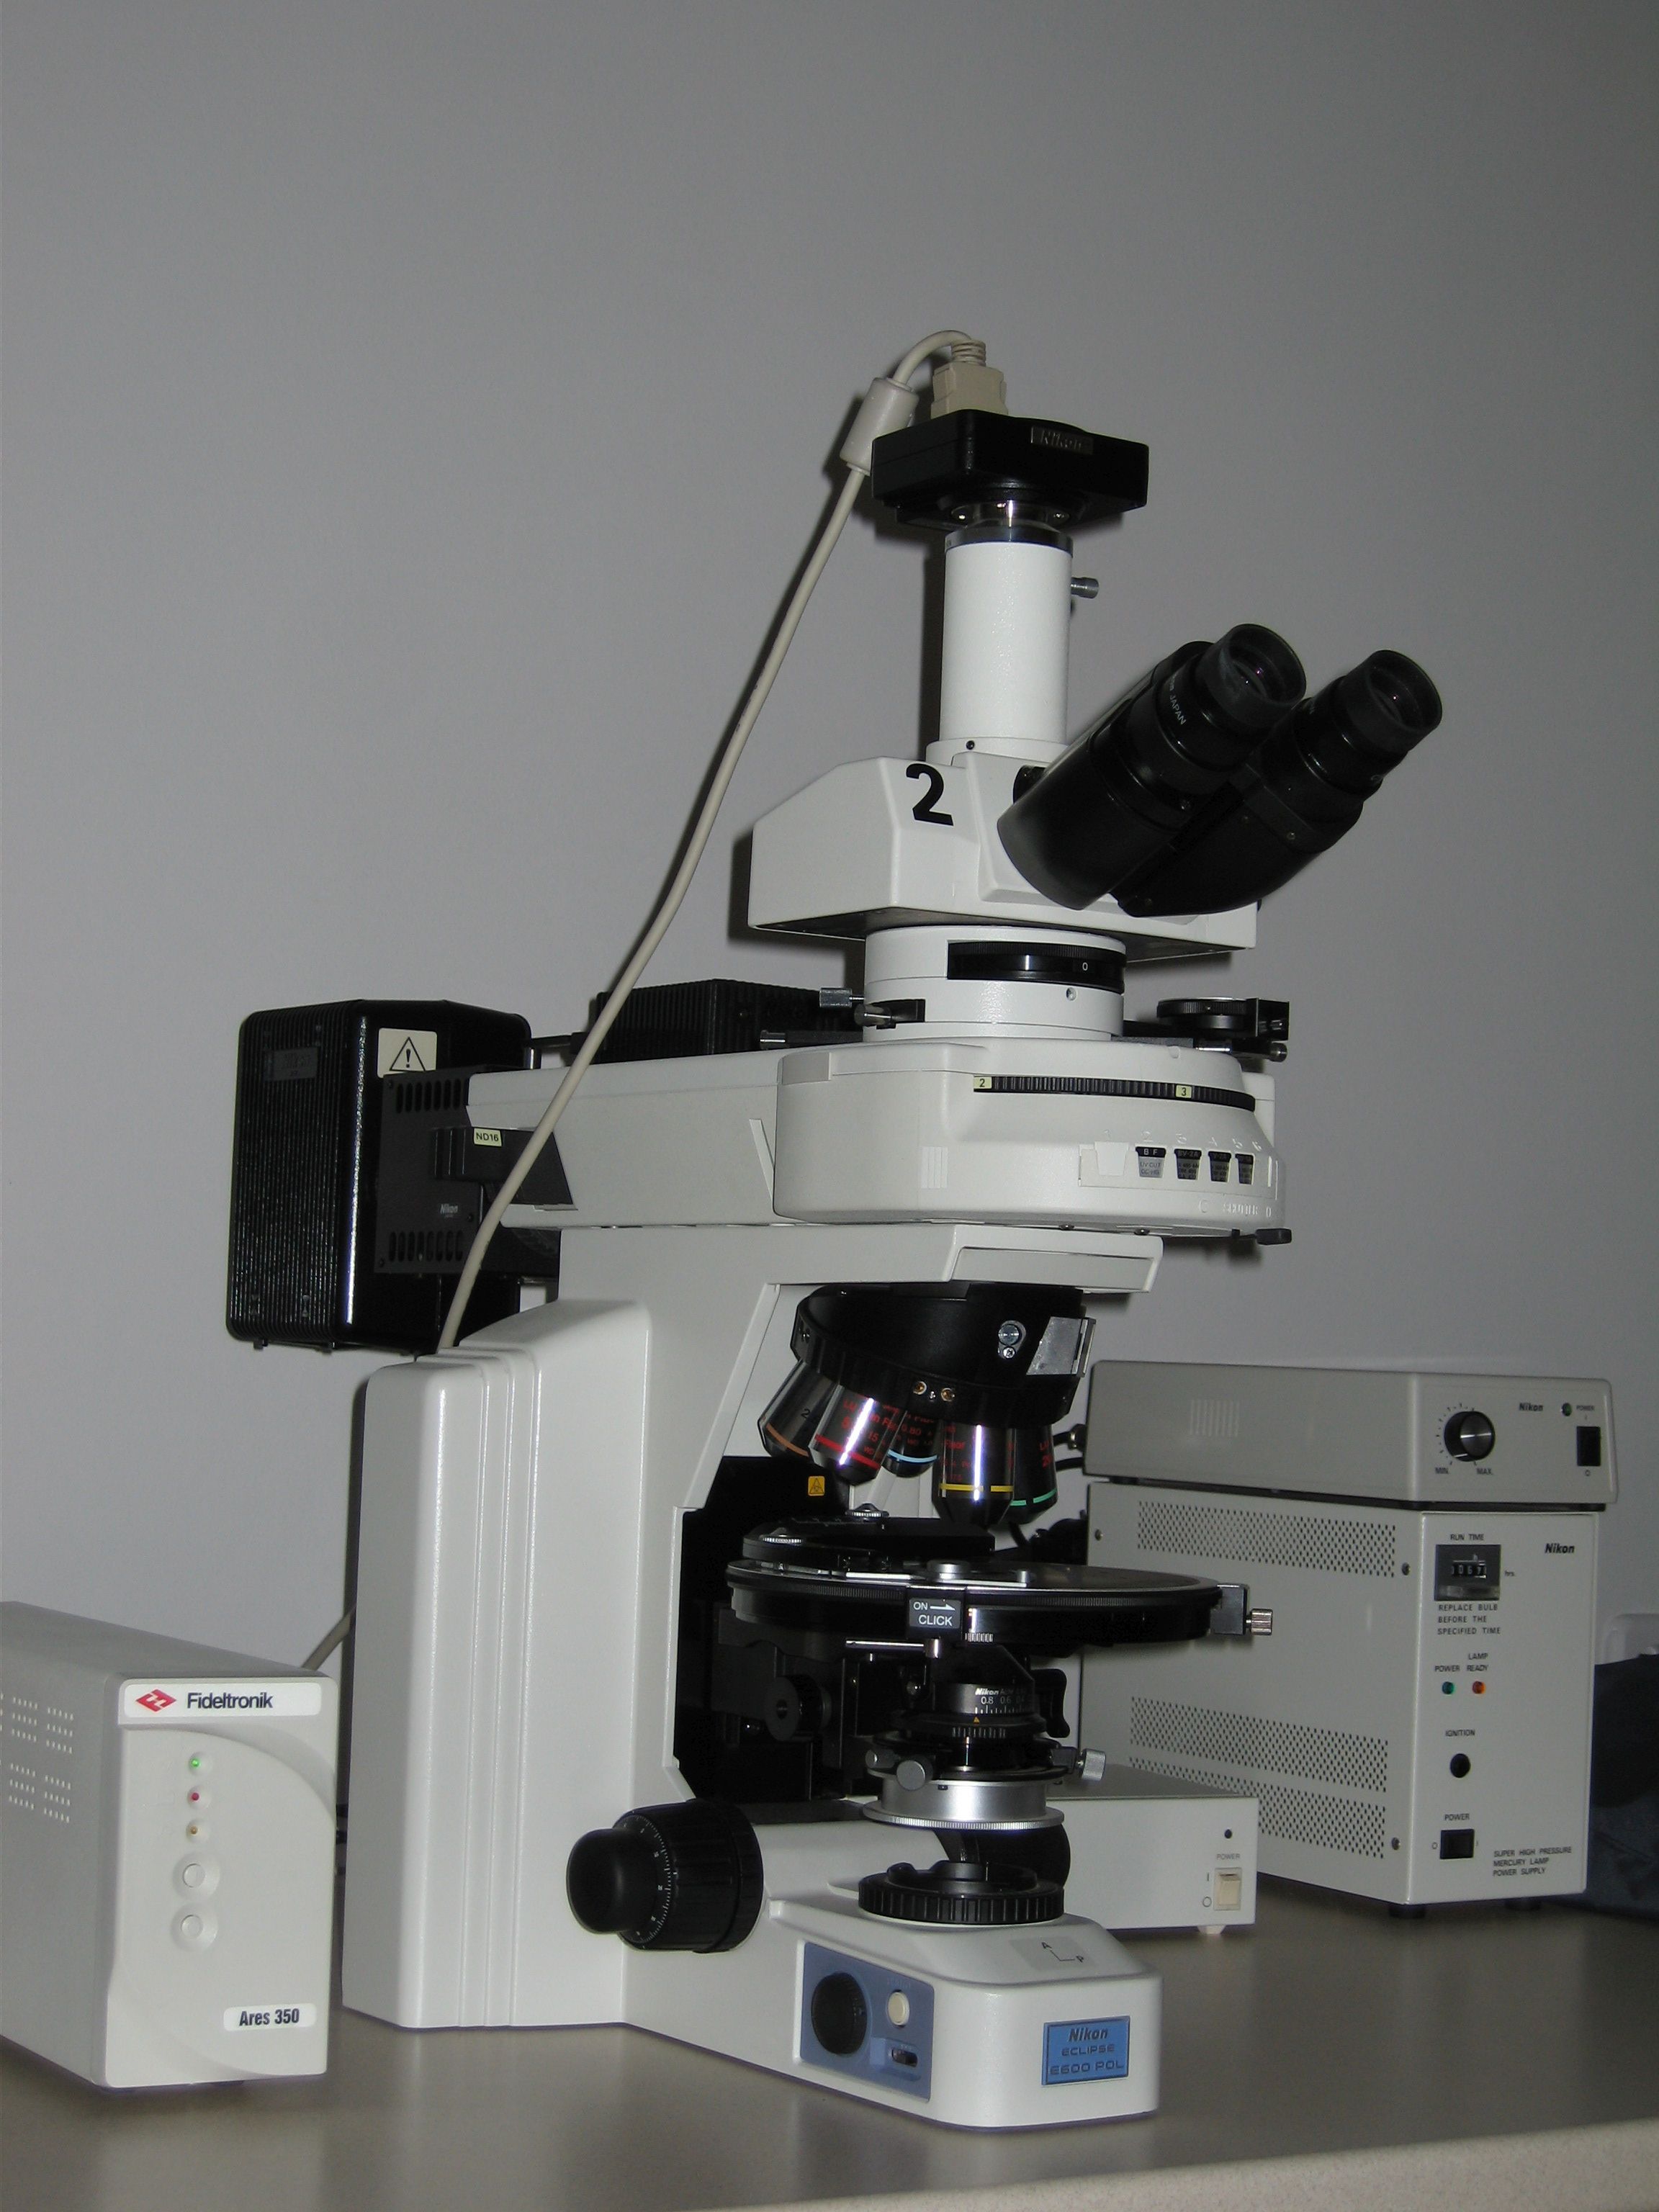
- Minero-petrographic examination was conducted under a polarizing microscope on uncovered, polished thin sections. The following parameters were determined:
– type of fabric (homeoblastic or heteroblastic, etc.);
– boundary-shapes of the calcite/dolomite grains;
– maximum grain size, a parameter of significant diagnostic importance since it is mainly linked to the grade of metamorphism achieved by the marble;
– identification of accessory minerals - Cathodoluminescence (CL) was conducted using a CITL Mk5-2 cold cathode stage combined with a polarizing microscope at the Institute of Geological Sciences, Polish Academy of Sciences. Operating conditions were ~17 kV beam energy, ~0.3 mA beam current at ~0.003 mBar vacuum. Microphotographs were recorded with a Nikon DS-Ri1 digital camera (1-6 seconds exposure time, ISO 200).
- Accessory minerals were analyzed by scanning electron microscopy (SEM) using a ZEISS Sigma VP FE-SEM (variable pressure field emission SEM) at the Faculty of Geology, University of Warsaw. Thin sections were polished, carbon-coated and analyzed at 50 Pa in the chamber. Electron beam acceleration voltage of 20kV was set for imaging and EDS analyses. The SEM probe current is estimated to greatly exceed 10nA. EDS analyses were collected with two Bruker XFlash 6|10 SDD type detectors.
- Geochemical analysis consisted of:
– Stable C and O isotope ratios were measured in two laboratories: in Warsaw in the Stable Isotope Laboratory (Institute of Geological Sciences, PAS) and in Erlangen in the Stable Isotope Laboratory (GeoZentrum Nordbayern, University of Erlangen-Nürnberg, Germany).
A Thermo KIEL IV Carbonate Device connected on-line to a ThermoFinnigan Delta Plus mass spectrometer in a dual inlet mode was used in Warsaw. Measurements of the NBS19 standard were conducted after 10 successive measurements of samples and the reproducibility of the measurements (1σ) was ±0.03 ‰ for δ13C and ±0.07 ‰ for δ18O. A Gasbench II preparation line connected on-line to a ThermoFinnigan Five Plus mass spectrometer in a continuous flow mode was used in Erlangen. Reproducibility (1σ) was verified by replicate analyses of laboratory standards calibrated to NBS19 and LSVEC and is better than ±0.07 ‰ for δ13C and ±0.04 ‰ for δ18O. In both laboratories samples were reacted with 100% phosphoric acid at 70 °C. All values measured are reported as delta notations (δ13C and δ18O) in per mil relative to V–PDB by assigning a δ13C value of +1.95 ‰ and a δ18O value of −2.20 ‰ to NBS19 and −46.6 ‰ and −26.7 ‰ to LSVEC international reference materials.
- 87Sr/86Sr isotope ratio was measured in the Isotope Laboratory at the University of Poznań, Poland. Sr was chemically separated from about 50 mg of powdered sample. Strontium was loaded with a TaCl5 activator on a single Re filament and analysed in dynamic collection mode on a Finnigan MAT 261 mass spectrometer. During the course of each analysis series, the NIST-987 Sr standard was also measured. All the measured 87Sr/86Sr values of samples were adjusted to the preferred value of 0.710248 for NIST−987.
- Concentration of major elements (Ca, elements substituting for Ca2+ in calcite crystal lattice and those related to silicates and phyllosilicates) was measured by inductively coupled plasma optical emission spectroscopy (ICP−OES) in the Centre for Archaeological Science, KU Leuven, Belgium. 200 mg of each powdered sample was dried for 48h at 60°C, dissolved in 3M HNO3, filtered and analyzed with ICP-OES. A Varian 720-ES (simultaneous ICP-OES with axially viewed plasma), supplied with a double-pass glass cyclonic spray chamber, concentric glass nebulizer SeaSpray and a ‘high solids’ torch, was used. Lower limits of detection varied from < 1 ppm (e.g. Mn) to 30 ppm (e.g. Si).
- Trace elements, including rare earth elements (REE), were measured by inductively coupled plasma mass spectrometry (ICP−MS) in AcmeLabs, Vancouver, Canada. Bulk rock samples were mixed with LiBO2/Li2B4O7 flux and melted in Pt crucibles in an oven. The cooled beads were dissolved in ACS grade nitric acid and then analyzed. Lower limits of detection were from 0.01 to 0.1 ppm for REE and 0.1 for the other trace elements.
- XRD analyses were performed in LAMA laboratory in Venice.
For geochemical examinations marbles were powdered either with a rotary Dremel 3000 tool equipped with sintered diamond micro-drills or in an agate mortar.